Your SIMPLE and FUN guide to better understanding the Market, Trading & Investing
www.tradingwithjoe.com & joe@tradingwithjoe.com
Market at a Glance
Market Type: 🟡🟢 Bull Market but Market is in a range
Current Market Sentiment: 🟡🟢 Summer vacations and meh
Recent Market Action: 🟡🟢 For now, another light bounce off the 50-day moving average, sector rotation is still rotating
Short Trend: 🟢 (8-day EMA slanting up and ABOVE the 21-day EMA)
Medium Trend: 🟢 (21-day EMA slanting up & ABOVE the 50-day SMA)
Long Trend: 🟢 (50-day SMA above the 200-day SMA)
Current Situation
Once again, last week saw the price on the S&P 500 lightly bounce off the 50-day moving averages (red line) as you can see below:
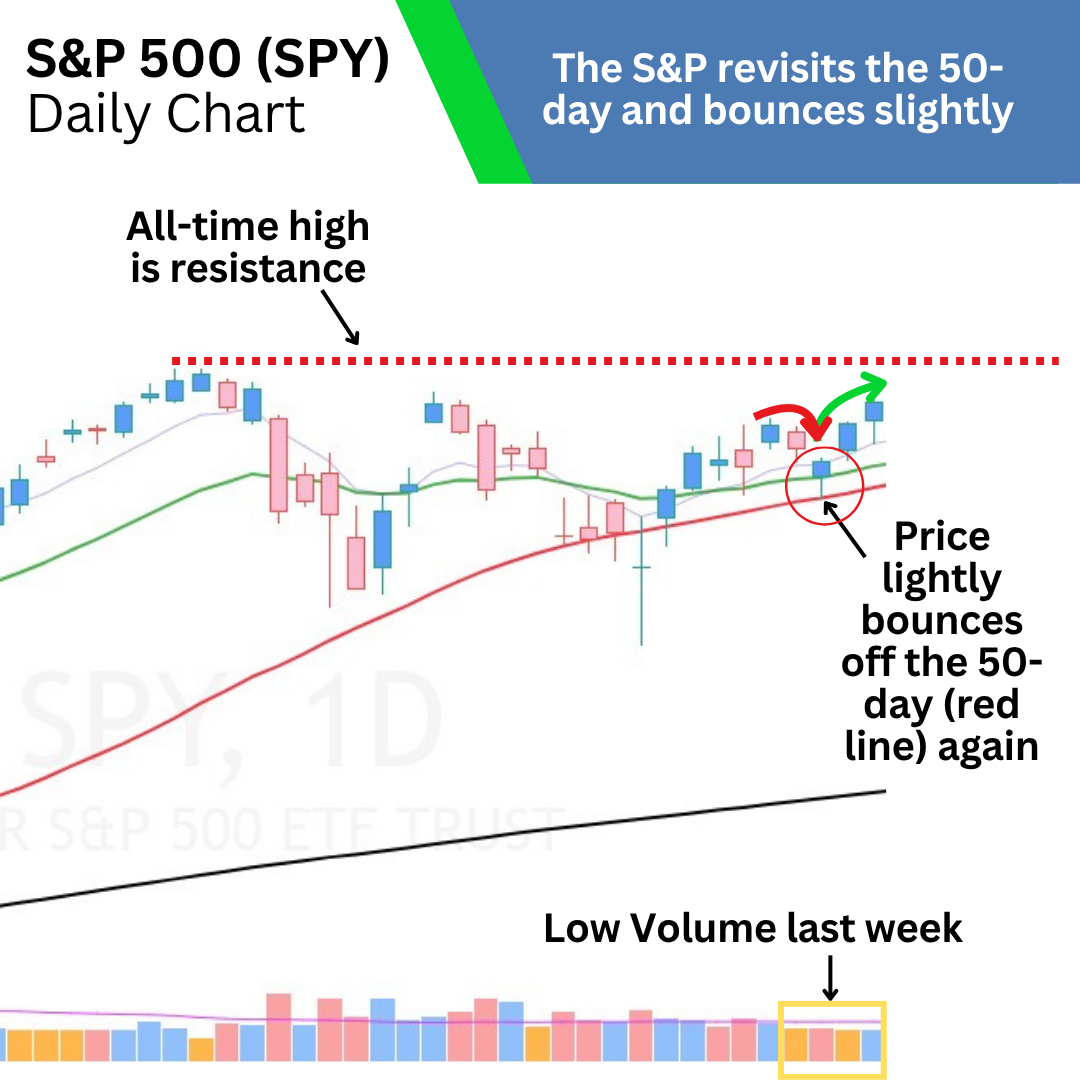
Now that the 21-day (green line) and the 50-day (red line) moving averages are so close together, it doesn't take much movement to cross below the 21-day (boo) or to bounce off the 50-day (yay!). So if you look to the left of the chart, you'll see how far apart the 21-day and 50-day were from each other. Since all the moving averages are relatively close and pointing upward, this is a good thing for the Bullish uptrend. We just have one thing to deal with for the uptrend to get going again: The S&P needs to break through the major zone of resistance at its all-time highs.

Okay, it doesn't have to break through like that .gif! LOL
Also, volume was extremely low last week, typically blamed on "the summer doldrums" – while the jet-set Institution leaders, fund managers, and big traders vacay in (snooty accent) the Hamptons, the Côte d'Azur, Ibiza (pronounced ih-BEEEE-thuh), or... Epcot. So, for a bit there shouldn't be any major moves in either direction (knock on wood!).
And as of right now, the S&P and Nasdaq are still in ranges, giving us a textbook sine curve.
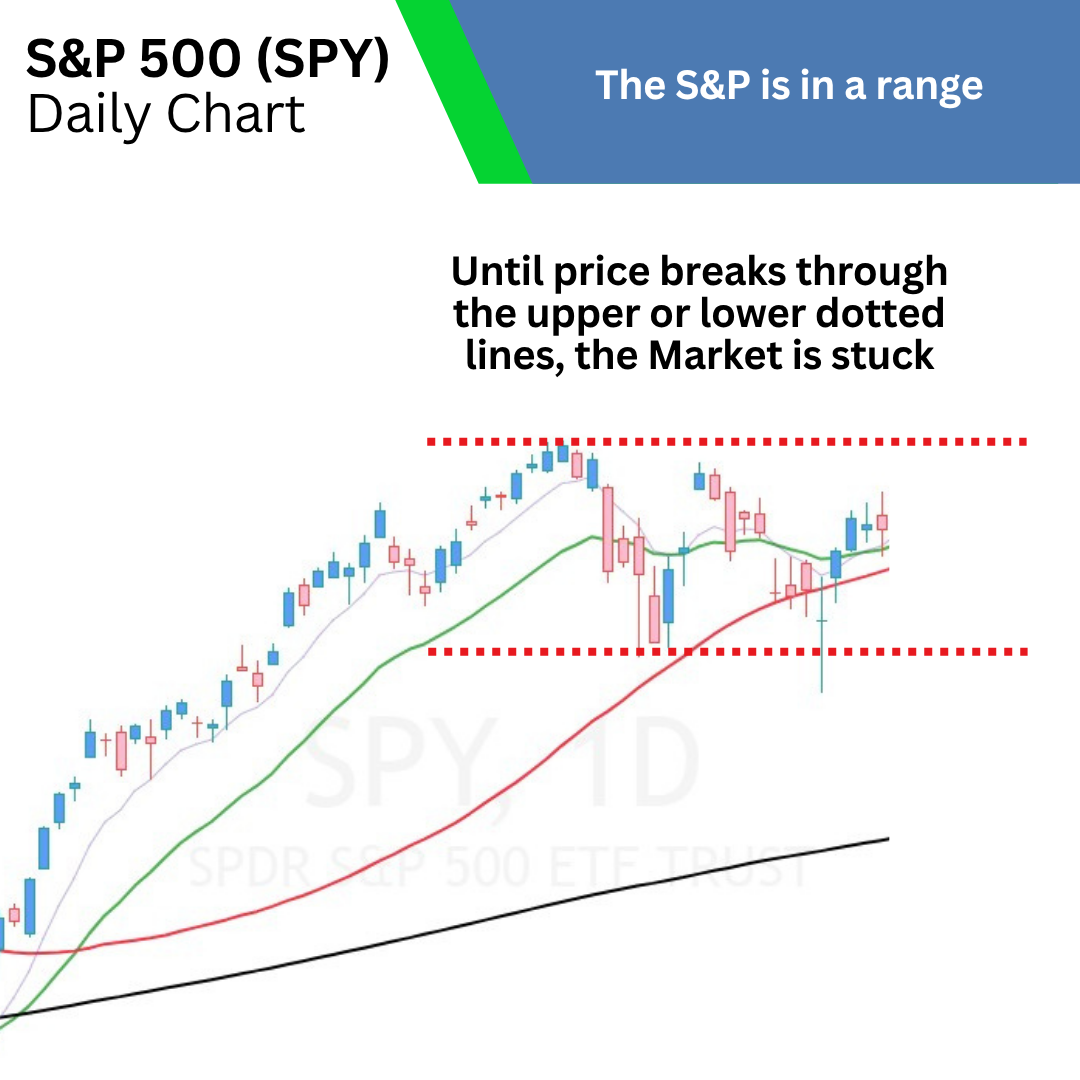
Which direction will price breakout? Up or down? We'll how to wait and observe what this sleepy giant wants to do.

Golden Nugget$
How to Draw Simple Horizontal Support Lines
If you thought that read the same as last week, read it again.
I showed you how to draw simple resistance lines last week. I thought I'd show you how to draw simple support lines this time!
Just like for resistance lines, drawing sesistance lines is an "art", not so much so a "science." However, I think that all of you can do this. 😊
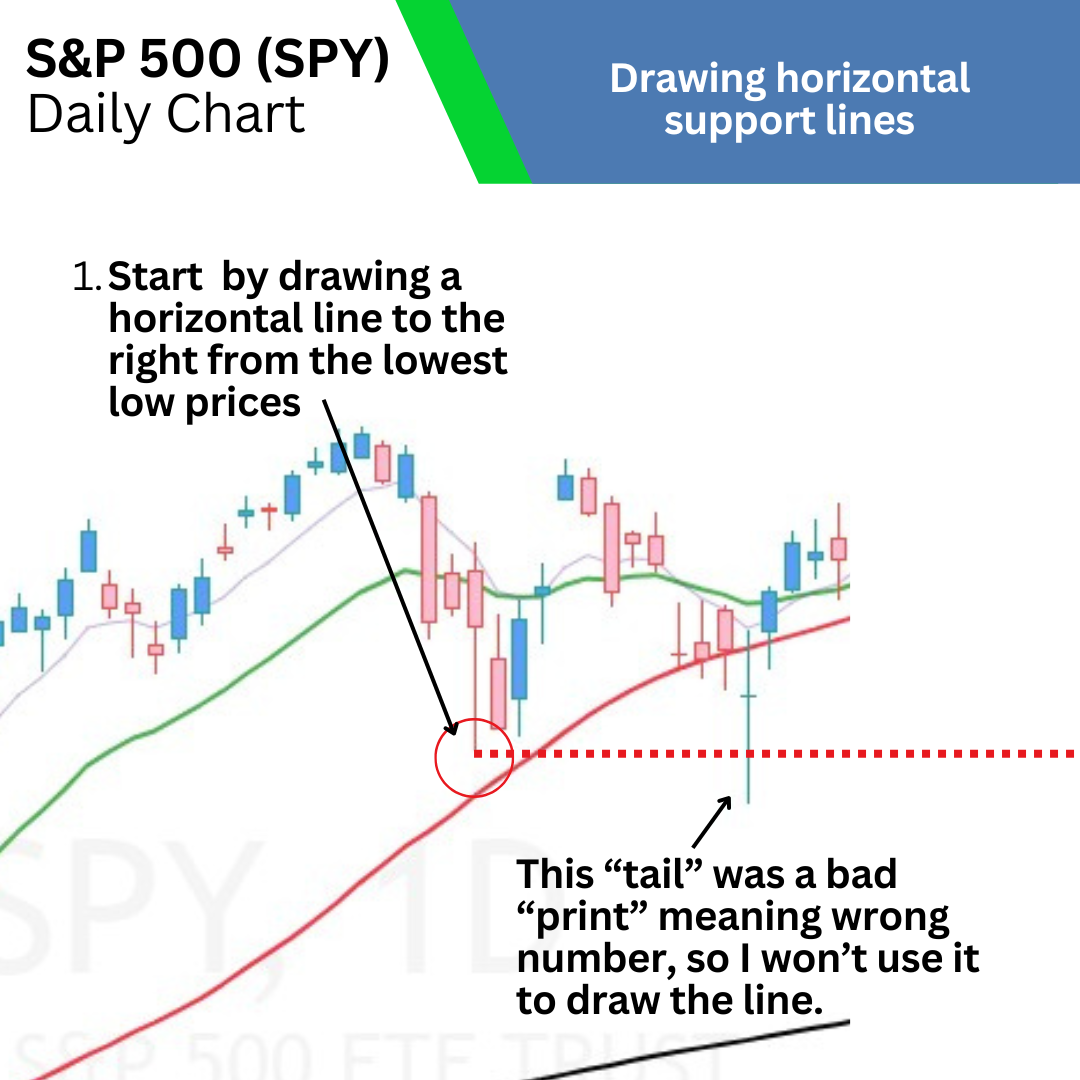
- Start with a few months of price bars nearest to the stock or Index's current price. Draw a horizontal line from the lowest low price to the right (as far right as you want)
- Continue drawing a horizontal line from the next low price.
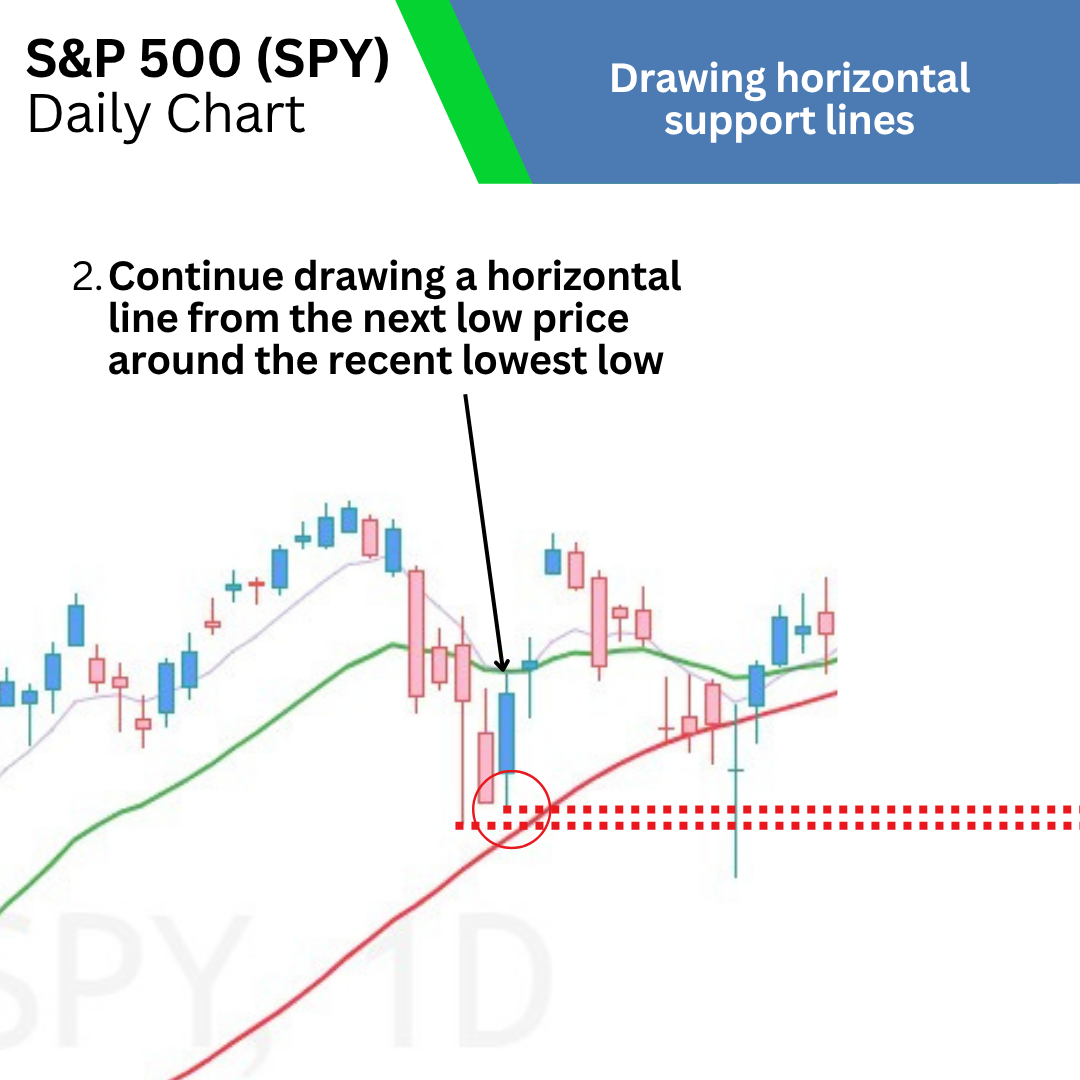
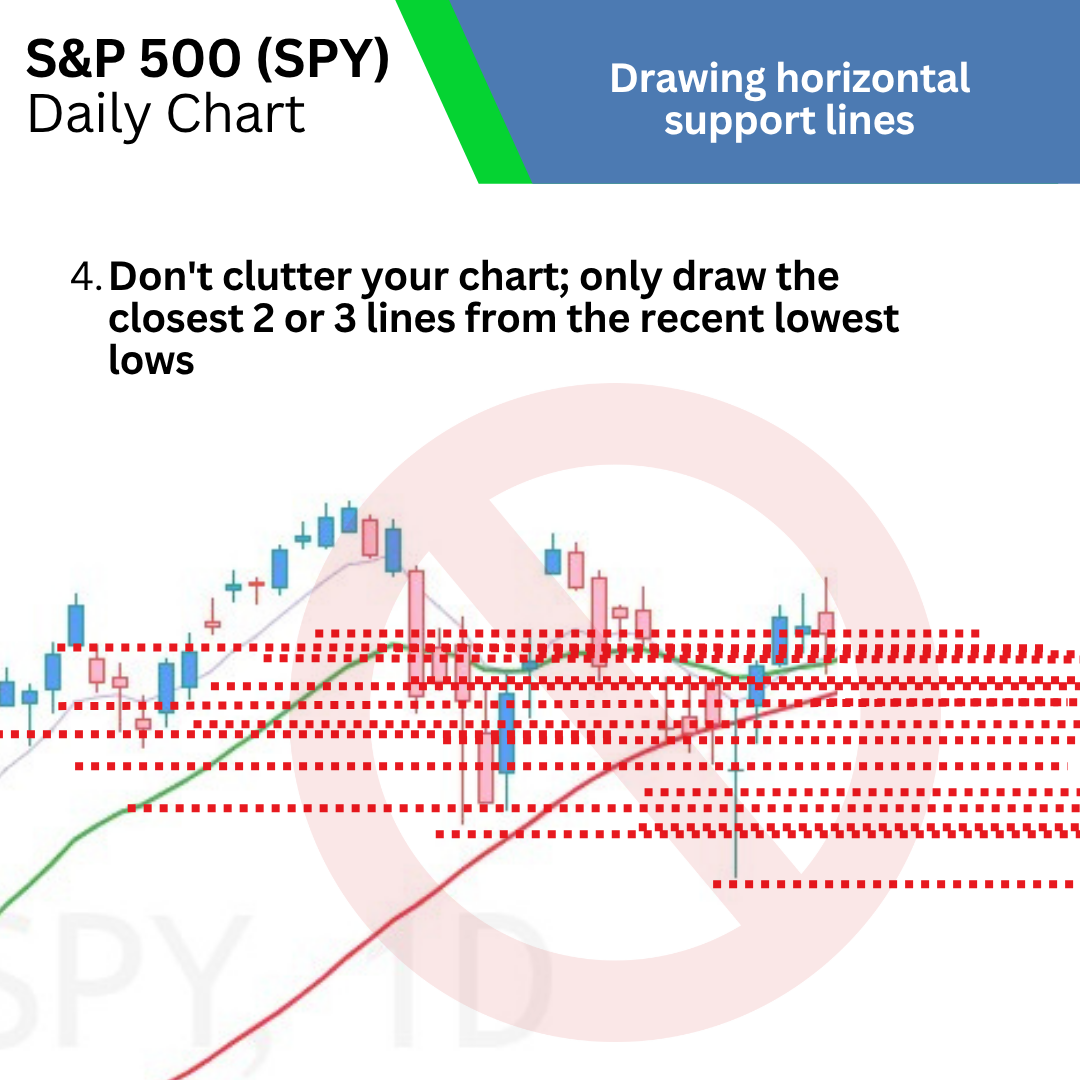
- Don't clutter your chart with hundred of these lines (like some indicators will do). Just draw the closest 2 or 3 recent lowest lows.
Some Important Points
- We would expect price to stop going down once it hits a good support line. If price doesn't stop when it hits the lowest low recently and keeps sliding, that's not good! Price could keep declining until it finds a good support zone.
- Remember that resistance can become support once price breaks through to the next floor up (in an office building).
- Remember that support can become resistance once price falls through the ceiling to the floor below (in an office building)
- Keep your charts are clear and easy to understand, not full of lines, and indicators, and the phone number to your local pizza hutt...Jabba the Hutt?
- These lines represent "zones"; don't mistake them for exact prices (not $751.33; more like $745-$755)
- You're always drawing support lines from the recent "bottom" prices, not somewhere in the middle of prices
Here's a support zone example of Micron (MU) from last year:
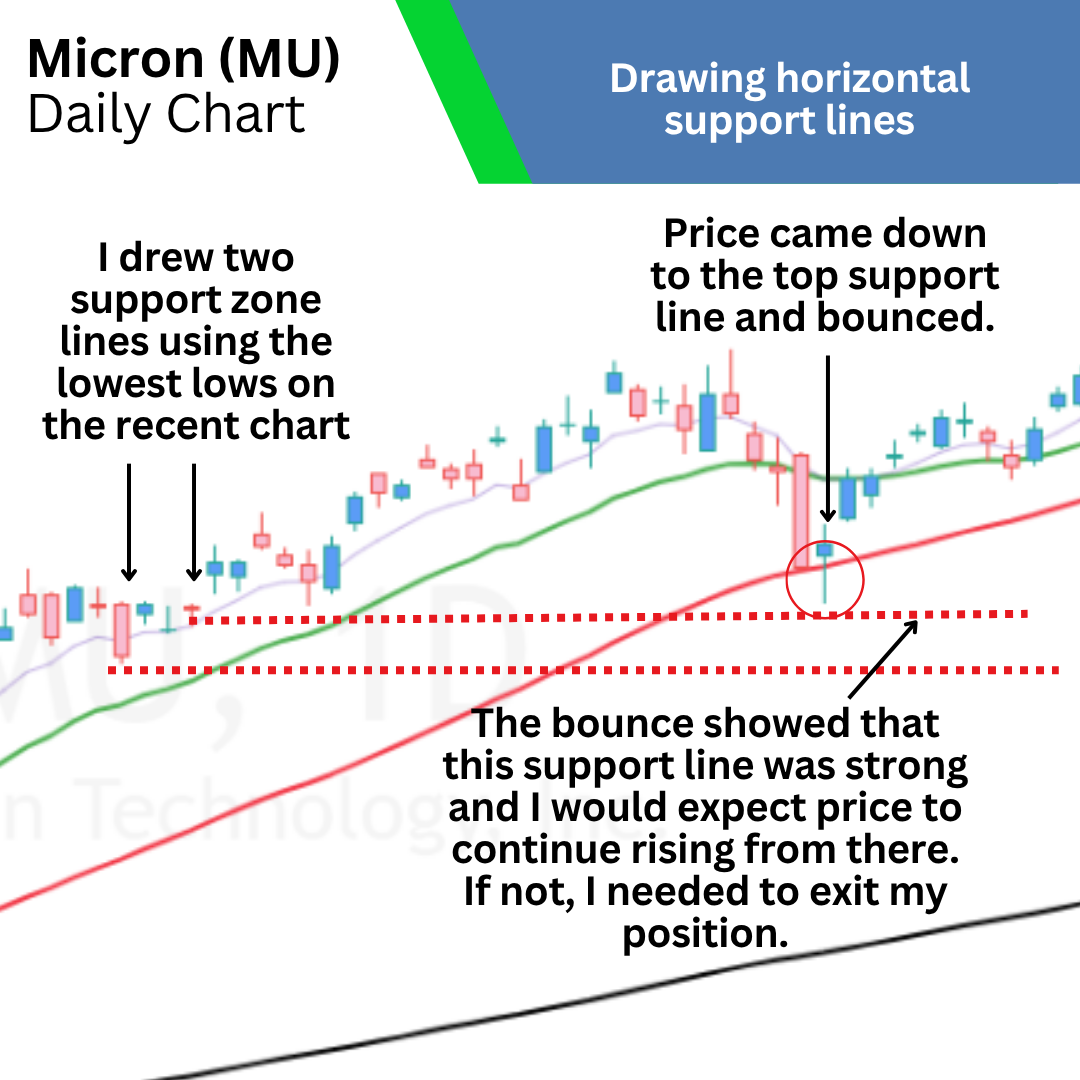
I hope this helps you better understand how to draw simple horizontal support lines. 😄

What I'm Doing
I'm 30% invested, still mostly in cash for now but eyeing the Market for better things to come.
As long as price on the S&P holds its 21-day EMA, I'll be happy. BUT, that all-time high (a resistance zone now) still taunts at Price, like the king of the hill. (Be strong price! You can do it!)

Always remember: The Market will do whatever the Market wants to do!
Happy trading and investing!
-Joe
P.S. Back to a good keyboard and hopefully no ddddoubble letters, lol! 😄

This Week's Talk Like A Traderrrrrr
Bounce: When the price of a stock or index drops down, hits a "buy zone" where investors think it's a "steal" and bounces back up as lots of people buy it.
Consolidation Base: When a period of consolidation becomes a foundation for a new uptrend to rise out of.
Consumer Defensive / Staples Stocks: The stocks of companies that make and sell daily household products like toothpaste, diapers, drinks, foods, etc. that people will buy even if the economy is in bad shape. The price of these stocks doesn't move much except for when mutual fund managers are trying to take shelter in them during Market down times.
Institutions: These are the people who actually move the market and stocks: Mutual Fund Managers, Hedge Fund Managers, Pension Fund Managers, Investment Bankers, Sovereign Wealth Fund Managers, Family Office Managers, lowly billionaires just trying to get by, and others who manage billions of dollars worth of stocks. Their combined actions of buying and selling make the market and stocks move.
IPO: Initial Public Offering. When a stock first becomes available for public purchase on the stock market. At least 90% fail, so don't be thinking this is your pot of gold at the end of a rainbow.
Pullback: A temporary, common decline of 3-9% in a stock or Index's price.
Range: When the price of a stock or Index moves sideways, where the highest high is the top of the range and the lowest low is the bottom of the range.
Resistance Zone: A zone of prices where sellers are waiting to sell a stock or index. If resistance is weak, price can break through it and continue moving up. If resistance is strong, price will come to a stop and be rejected back down like an overcharged credit card.
The S&P 500: The paramount index made up of 500 of America's top stocks. It's frequently traded using the exchange-traded fund SPY.
Sector Rotation: When many fund managers "rotate" their stock portfolios into different stocks and stock sectors. This can happen many times throughout any year, but frequently happens in the middle and near the end of the year. Sector rotations can also be a warning flag of an approaching correction.
Volume: The amount of shares in a stock or index traded in a day. Bulls want to see much more buying than selling. Bears want to see much more selling than buying. Daily and weekly volume can also show how strong or weak a trend is.

Enjoying this newsletter?
Forward it to a friend. 😄
If you received this email as a forward, you can sign up for my newsletter here.
Got a question or comment? Email me at joe@tradingwithjoe.com
Need an online broker to open a Roth IRA or trading account? I use Tastytrade (check them out here).
All stock and Index charts are provided courtesy of TradingView
Need charting software? I use TradingView (check it out here).
As an Amazon Associate I earn from qualifying purchases.